


News Releases
Stay in the know
CALGARY, July 29, 2015 /CNW/ - Secure Energy Services Inc. ("Secure" or the "Corporation") (TSX – SES) today announced operational and financial results for the three and six months ended June 30, 2015. The following should be read in conjunction with the management's discussion and analysis ("MD&A"), the condensed consolidated financial statements and notes of Secure which are available on SEDAR at www.sedar.com.
OPERATIONAL AND FINANCIAL HIGHLIGHTS FOR THE SECOND QUARTER ENDED JUNE 30, 2015
During the three months ended June 30, 2015, Secure completed and commissioned two new SWDs located in the active Montney and Deep Basin resource plays. There is high demand for water disposal in these areas and as such, Secure anticipates these facilities to operate at full capacity with the ability to build out additional infrastructure in response to market activity. Seasonality of the oil and gas industry, including the length of spring break-up, weather conditions, and the timing of road bans has the most significant effect on second quarter results. Financial results were influenced by muted activity levels during the second quarter of 2015 due to an extended spring break-up and the decline in oil and gas prices. Total rig count and meters drilled across the WCSB were down 53% and 43% respectively, from the 2014 comparative period as drilling programs shut down near the end of March and did not begin to ramp-up until late June. For the three months ended June 30, 2015, Secure generated adjusted EBITDA of $17.5 million. Both revenue and adjusted EBITDA were in line with the Corporation's expectations for the period given the slow ramp-up in drilling activity, a decrease in activity levels typically associated with the second quarter due to seasonality, and the current commodity price environment.
The seasonal slowdown in industry activity, compounded by the weakness in commodity pricing, had the most significant impact on the DS division results as operations are tied directly to drilling activity. PRD division revenues are heavily concentrated in production related services and with the addition of seven new facilities since the second quarter of 2014, this alleviated a portion of the impact on consolidated results. The OS division continued to post solid results on the back of increased project work, integrated service offerings, and geographic expansion through acquisitions executed in 2014.
During the quarter, Secure focused on proactively working with its customers to lower their costs and create efficiencies in handling their fluids and solids by providing innovative and integrated service solutions. In addition, Secure continued to streamline and reduce its own cost structure through cost savings initiatives implemented in the first quarter of 2015 and identifying ways to bring capital projects online faster and more cost effectively. As such, Secure will continue its prudent approach to capital spending by allocating capital to projects that generate the highest rates of return.
Secure remained active in the second quarter evaluating various acquisition opportunities that complement the Corporation's existing service offerings and will expand the geographic presence to specific locations where customers are continuing with active drilling programs.
The operating and financial highlights for the three and six month periods ending June 30, 2015 can be summarized as follows:
|
Three Months Ended June 30, |
Six Months Ended June 30, | ||||||||
|
($000's except share and per share data) |
2015 |
2014 |
% change |
2015 |
2014 |
% change | |||
|
Revenue (excludes oil purchase and resale) |
112,533 |
155,690 |
(28) |
282,185 |
361,322 |
(22) | |||
|
Oil purchase and resale |
244,036 |
412,249 |
(41) |
440,931 |
732,829 |
(40) | |||
|
Total revenue |
356,569 |
567,939 |
(37) |
723,116 |
1,094,151 |
(34) | |||
|
Adjusted EBITDA (1) |
17,507 |
40,393 |
(57) |
57,668 |
97,084 |
(41) | |||
|
Per share ($), basic |
0.13 |
0.34 |
(62) |
0.45 |
0.82 |
(45) | |||
|
Per share ($), diluted |
0.13 |
0.33 |
(61) |
0.45 |
0.80 |
(44) | |||
|
Net (loss) earnings |
(16,780) |
6,564 |
(356) |
(20,003) |
29,553 |
(168) | |||
|
Per share ($), basic |
(0.12) |
0.06 |
(300) |
(0.15) |
0.25 |
(160) | |||
|
Per share ($), diluted |
(0.12) |
0.05 |
(340) |
(0.15) |
0.24 |
(163) | |||
|
Adjusted net (loss) earnings(1) |
(16,244) |
6,564 |
(347) |
(15,296) |
29,553 |
(152) | |||
|
Per share ($), basic |
(0.12) |
0.06 |
(300) |
(0.12) |
0.25 |
(148) | |||
|
Per share ($), diluted |
(0.12) |
0.05 |
(340) |
(0.12) |
0.24 |
(150) | |||
|
Funds from operations (1) |
17,022 |
40,956 |
(58) |
53,247 |
97,313 |
(45) | |||
|
Per share ($), basic |
0.12 |
0.35 |
(66) |
0.41 |
0.83 |
(51) | |||
|
Per share ($), diluted |
0.12 |
0.34 |
(65) |
0.41 |
0.80 |
(49) | |||
|
Dividends per common share |
0.06 |
0.05 |
20 |
0.12 |
0.09 |
33 | |||
|
Capital expenditures (1) |
21,961 |
82,338 |
(73) |
67,634 |
149,075 |
(55) | |||
|
Total assets |
1,420,412 |
1,157,212 |
23 |
1,420,412 |
1,157,212 |
23 | |||
|
Long-term borrowings |
234,671 |
177,541 |
32 |
234,671 |
177,541 |
32 | |||
|
Common Shares - end of period |
136,440,802 |
118,890,654 |
15 |
136,440,802 |
118,890,654 |
15 | |||
|
Weighted average common shares |
|||||||||
|
basic |
136,186,284 |
118,489,217 |
15 |
129,475,350 |
117,865,604 |
10 | |||
|
diluted |
136,186,284 |
121,757,066 |
12 |
129,475,350 |
121,100,256 |
7 | |||
|
(1)Refer to "Non GAAP measures and operational definitions" and "Additional GAAP measures" for further information | |||||||||
REVENUE OF $112.5 and $282.2 MILLION FOR THE THREE AND SIX MONTHS ENDED JUNE 30, 2015
- Processing and disposal volumes at PRD facilities for the three and six months ended June 30, 2015 remained relatively consistent over the 2014 comparative periods; and recovery volumes increased 15% and 17% respectively over the 2014 comparative periods. The sustained and increased volumes achieved are due to the addition of seven new facilities completed and commissioned subsequent to the second quarter of 2014. Offsetting this increase was a 44% and 47% decrease in crude oil pricing from the 2014 comparative periods which negatively impacted recovered oil revenue. Overall, this resulted in the PRD divisions achieving revenue (excluding oil purchase/resale) for the three and six months ended June 30, 2015 of $57.2 million and $126.7 million down 14% and 3% respectively from the 2014 comparative periods.
- Oil purchase and resale revenue in the PRD division for the three and six months ended June 30, 2015 decreased by 41% and 40% from the 2014 comparative periods to $244.0 million and $440.9 million. The price of crude oil declined by 44% and 47% for the three and six months ended June 30, 2015 from the 2014 comparative periods which directly reduces volumes of oil purchased and resold during the quarter. Oil purchase/resale service revenue and expense are a direct offset; however, they are expected to fluctuate with the price of crude oil throughout 2015;
- Activity in the DS division is strongly correlated with oil and gas drilling activity in the WCSB which saw a decline in active rig count for the three and six months ended June 30, 2015 of 53% and 45% from the 2014 comparative periods. As a result, DS division revenue for the three and six months ended June 30, 2015 decreased 57% and 47% to $29.0 million and $97.9 million from the 2014 comparative periods. The second quarter typically experiences lower rig counts and drilling activity due to spring break-up. Through the three and six months ended June 30, 2015, the DS division maintained a 29% market share. The division's activity has and will continue to trend with industry rig counts, oil and gas price variances, the customer base and their level of activity.
The decrease in revenues in the PRD and DS divisions for the three and six months ended June 30, 2015 were offset by the following:
- OS division revenue has remained strong for the three and six months ended June 30, 2015 increasing 24% and 28% to $26.3 million and $57.6 million over the 2014 comparative periods. The overall increase in 2015 revenues is a direct result of increased Projects service line work, and four acquisitions completed during 2014. The OS division continues to grow through larger scale project work, diversified and integrated services, and expansion into new geographic areas.
- ADJUSTED EBITDA OF $17.5 MILLION AND $57.7 MILLION FOR THE THREE AND SIX MONTHS ENDED JUNE 30, 2015
- Diversification and integration across Secure's three divisions has contributed to positive EBITDA for the three and six months ended June 30, 2015 as certain service lines are not as directly impacted by drilling activity. Adjusted EBITDA for the three and six months ended June 30, 2015 was $17.5 million and $57.7 million, a 57% and 41% decrease from the 2014 comparative periods. Overall, this result was in line with Secure's expectation for the periods given a reduction in active rig count and meters drilled, primarily affecting the DS division, and reduced crude oil prices impacting both the PRD and DS divisions. These factors were offset by the addition of new facilities in 2014 and the first half of 2015 in the PRD division, and the solid performance of the OS division driven by project based work and strategic acquisitions completed during 2014.
- ADJUSTED NET LOSS OF $16.2 MILLION AND $15.3 MILLION FOR THE THREE AND SIX MONTHS ENDED JUNE 30, 2015
- For the three and six months ended June 30, 2015, Secure's adjusted net loss is $16.2 million and $15.3 million as a result of the factors discussed above impacting adjusted EBITDA combined with the following: increased share-based compensation resulting from the timing of grants of options, RSU's and PSU's; increased depreciation expense from new PRD facilities commissioned in 2014 and 2015; increased amortization expense resulting from intangible assets acquired on the eight strategic acquisitions completed during 2014; and a $3.0 million tax impact due to recent corporate tax rate increases. These increased costs were partially offset by a change in the estimated useful life of property, plant and equipment at PRD facilities effective January 1, 2015 that resulted in a reduction in depreciation expenses.
- 2015 CAPITAL BUDGET
- Secure's capital budget is expected to be in the range of $100.0 million to $150.0 million of committed capital for 2015. Total capital expenditures for the six months ended June 30, 2015 were $67.6 million, including both growth and expansion capital.
- Major expenditures in 2015 include:
- Three facilities were completed and commissioned in the first quarter of 2015: Tulliby Lake FST, 13 Mile FST conversion, and the Rycroft FSR;
- Big Mountain SWD, completed and commissioned in June 2015, located south of Grande Prairie which will service customers operating in the Deep Basin. Additional infrastructure will be required at this location as the market develops and demand increases;
- Wonowon SWD, completed and commissioned in June 2015, located in Northeast British Columbia which will service customers operating in the Montney formation. Additional infrastructure and capacity will be required as market demand increases;
- Rycroft FSR, expanded and commissioned the facility to include water disposal services during the second quarter;
- Commenced construction of additional landfill cells at the Willesden Green and Pembina Landfills in the second quarter, with the additional cell capacity to be available in the fourth quarter of 2015;
- Pre-design and engineering of future facility locations;
- Various expansions at existing facilities to increase capacity including treaters, disposal wells and tanks; and
- Specialized rental equipment for specific OS division projects.
- Secure is expecting to reduce its capital cost to construct by 10-20% in 2015 as a result of identifying cost efficiencies and implementing cost saving strategies. This will allow Secure to provide additional services in a more timely and cost effective manner.
- RESEARCH & DEVELOPMENT
- Secure continues to focus on research and development projects to expand the value chain of services offered to customers, and to provide innovative and cost effective solutions to reduce waste in the drilling and production processes. Secure's current research and development initiatives include the following:
- Water Recycling Initiative: Recycling of frac flow-back fluid received at the South Grande Prairie FST to enable producers to reuse the fluid in additional frac jobs. Secure has completed a three month trial during the three months ended June 30, 2015 to understand the range and types of flow back water able to be processed, and has assessed the economic feasibility of the process. Trials in the facility have proven successful, and Secure is now planning to execute field trials in the next stage of development;
- Oil Based Mud ("OBM") Recycling: Secure is refining the technology to recycle OBM at the South Grande Prairie FST and will continue testing various grades of material received over the next six months;
- Research Lab: In July 2014, Secure opened a 7,000 square foot, fully equipped state of the art research laboratory facility to work directly with customers to create innovative drilling fluid systems to enhance efficiencies and reduce customer drilling days and costs in this commodity environment. Secure continues to invest in production chemicals to assist customers with enhanced oil recovery and oilsands solutions.
- Secure continues to focus on research and development projects to expand the value chain of services offered to customers, and to provide innovative and cost effective solutions to reduce waste in the drilling and production processes. Secure's current research and development initiatives include the following:
- MERGERS & ACQUISITIONS
- Secure has been active in discussions on various acquisition opportunities throughout the second quarter of 2015. Secure has issued letters of intent and has entered into confidentiality agreements to allow further evaluation of these opportunities into the third quarter of 2015. Secure remains patient in executing on any acquisition opportunity to ensure the right acquisitions are executed to complement existing services and/or expand geographical presence in key operating areas. Secure also continues to pursue oil and gas producer assets in active drilling formations that will provide a cash injection to producers and provide Secure the ability to increase capacity and operational efficiencies to service customers at these key locations.
- STRONG FINANCIAL POSITION
- Secure's debt to trailing twelve month EBITDA ratio was 1.6 as of June 30, 2015 compared to 2.0 as at December 31, 2014.
- As at June 30, 2015, the Corporation had $446.1 million available under its credit facility.
PRD DIVISION OPERATING HIGHLIGHTS
|
Three Months Ended June 30, |
Six Months Ended June 30, | |||||||
|
($000's) |
2015 |
2014 |
% Change |
2015 |
2014 |
% Change | ||
|
Revenue |
||||||||
|
PRD services (a) |
57,188 |
66,843 |
(14) |
126,682 |
130,146 |
(3) | ||
|
Oil purchase and resale service |
244,036 |
412,249 |
(41) |
440,931 |
732,829 |
(40) | ||
|
Total PRD division revenue |
301,224 |
479,092 |
(37) |
567,613 |
862,975 |
(34) | ||
|
Operating Expenses |
||||||||
|
PRD services |
29,902 |
26,488 |
13 |
63,732 |
50,223 |
27 | ||
|
Deduct: non-recurring items |
||||||||
|
Severance and other related costs |
- |
- |
- |
(188) |
- |
100 | ||
|
PRD services less non-recurring items (b) |
29,902 |
26,488 |
13 |
63,544 |
50,223 |
27 | ||
|
Oil purchase and resale service |
244,036 |
412,249 |
(41) |
440,931 |
732,829 |
(40) | ||
|
Total operating expenses |
273,938 |
438,737 |
(38) |
504,663 |
783,052 |
(36) | ||
|
Operating Margin (1) (a-b) |
27,286 |
40,355 |
(32) |
63,138 |
79,923 |
(21) | ||
|
Operating Margin (1) as a % of revenue (a) |
48% |
60% |
50% |
61% |
||||
|
(1)Refer to "Non GAAP measures and operational definitions" and "Additional GAAP measures" for further information | ||||||||
Highlights for the PRD division included:
- Secure's facilities are strategically located in high impact resource plays where producers have remained active in a lower commodity price environment. Facilities that were constructed during 2014 are now generating positive returns and contributing to 2015 results as these facilities can take twelve to eighteen months to ramp-up to full operating capacity. The continued focus on expansion in key locations and capacity constrained markets resulted in the PRD division achieving revenue of $57.2 million and $126.7 million for the three and six months ended June 30, 2015 down 14% and 3% from the 2014 comparative periods. Results achieved during the comparative second quarter of 2014 are considered to be exceptional given record levels of drilling activity from a short spring break-up, high commodity prices and supportive crude oil differentials, driving revenues that are not predictive of a typical second quarter.
- Processing: Processing volumes for the three and six months ended June 30, 2015 remained consistent with the 2014 comparative periods, and can be attributed to the addition of new facilities and expansions at current facilities subsequent to the second quarter of 2014 which include: completion of the Stanley FST in July 2014, Brazeau FST in December 2014, and the Tulliby Lake and 13 Mile FSTs in March 2015.
- Recovery: Throughput at the Corporation's facilities increased 15% and 17% for the three and six months ended June 30, 2015 over the 2014 comparative periods. Offsetting the increase in throughput is the decline in crude oil pricing of 44% and 47% from the 2014 comparative periods, and a continued compression of crude oil differentials which limited the Corporation's ability to fully utilize its FSRs and capitalize on crude oil marketing activities at its pipeline connected FSTs. As a result, recovery revenues have decreased by 37% and 29% for the three and six month periods ending June 30, 2015 over the 2014 comparative periods.
- Disposal: Disposal volumes for the three and six month periods ended June 30, 2015 were consistent with the 2014 comparative periods. Volumes have been maintained during a period of muted drilling activity due to the addition of new facilities subsequent to the second quarter of 2014 which include: completion of the Tulliby Lake landfill in November 2014, and the Big Mountain and Wonowon SWDs in June 2015. High demand for waste disposal has continued at both the Willesden Green and Pembina landfills therefore, construction of additional cells commenced in the second quarter of 2015, with the additional capacity anticipated to be available in the fourth quarter of 2015.
- Oil purchase/resale service: Revenue from oil purchase and resale services for the three and six month periods ended June 30, 2015 have decreased by 41% and 40% respectively from the 2014 comparative period. The price of crude oil has a direct impact on the volume of oil purchased and resold during the periods which correlates to the decline in crude oil pricing of 44% and 47% from the 2014 comparative periods. Oil purchase /resale revenue and expense are a direct offset however, they are expected to fluctuate with the price of crude oil.
- Operating margin as a percentage of revenue for the three and six months ended June 30, 2015 was 48% and 50% compared to 60% and 61% in the comparative periods of 2014. Margins are typically lower in the second quarter and are in line with management's expectations. Margins achieved in the 2014 comparative period are not typical of second quarter seasonal activity as weather conditions and activity were at all-time highs in the prior period. The decrease in margin for both the three and six months ended June 30, 2015 from the 2014 comparative periods resulted from: a reduction in recovered oil sales, upfront commissioning costs for new facilities, and price discounts on integrated service offerings leveraging all three of Secure's operating divisions. Increased activity and cost optimization measures taken in the first quarter of 2015 at the FSRs resulted in fixed costs being recovered through operations for the three months ended June 30, 2015.
- General and administrative ("G&A") expenses for the three months ended June 30, 2015 decreased 8% to $5.7 million from $6.2 million in the 2014 comparative period as a result of cost saving initiatives executed in the first quarter of 2015. G&A expenses for the six months ended June 30, 2015 increased 10% to $13.0 million from $11.8 million in the comparative period of 2014 due to non-recurring severance costs of $0.7 million and additional expenses incurred to support the opening of new facilities.
DS DIVISION OPERATING HIGHLIGHTS
|
Three Months Ended June 30, |
Six Months Ended June 30, | |||||||
|
($000's) |
2015 |
2014 |
% Change |
2015 |
2014 |
% Change | ||
|
Revenue |
||||||||
|
Drilling services (a) |
29,039 |
67,574 |
(57) |
97,903 |
186,256 |
(47) | ||
|
Operating Expenses |
||||||||
|
Drilling services |
27,215 |
51,444 |
(47) |
84,379 |
139,825 |
(40) | ||
|
Deduct: non-recurring items |
||||||||
|
Severance and other related costs |
(471) |
- |
100 |
(2,003) |
- |
100 | ||
|
Inventory impairment |
- |
- |
- |
(1,970) |
- |
100 | ||
|
Drilling services less non-recurring items (b) |
26,744 |
51,444 |
(48) |
80,406 |
139,825 |
(42) | ||
|
Operating Margin (1) (a-b) |
2,295 |
16,130 |
(86) |
17,497 |
46,431 |
(62) | ||
|
Operating Margin (1) as a % of revenue (a) |
8% |
24% |
18% |
25% |
||||
|
(1)Refer to "Non GAAP measures and operational definitions" and "Additional GAAP measures" for further information | ||||||||
Highlights for the DS division included:
- Revenue in the DS division is directly correlated with oil and gas drilling activity in the WCSB, most notably active rig counts and meters drilled. Traditionally, the second quarter experiences lower rig counts, reduction in meters drilled and reduced drilling activity due to spring break-up. In addition, activity levels in the second quarter of 2014 were at record highs and are not considered typical results that would be achieved in a second quarter. For the three and six months ended June 30, 2015, industry rig counts declined 53% and 45%, while meters drilled declined 43% and 42% respectively, from the 2014 comparative periods. As a result, revenue from the DS division for the three and six months ended June 30, 2015 decreased 57% and 47% to $29.0 million and $97.9 million from $67.6 million and $186.3 million in the comparative periods of 2014. This decrease in revenues for the three and six months ended June 30, 2015 was consistent with Secure's expectation given the decline in drilling activity.
- Revenue in the drilling fluids service line for the three and six months ended June 30, 2015 decreased 59% and 51% from the 2014 comparative periods. The decrease was a direct result of the decrease in active rig count and meters drilled from the 2014 comparative periods combined with a decline in the price of oil reducing revenue earned on oil based drilling fluid sold to customers, as the cost of oil based fluids fluctuates with the price of oil.
- Secure has continued to focus on providing customers with innovative solutions for deeper and increasingly technically complex wells. This has enabled the division to maintain market share of 29% for the three and six months ended June 30, 2015, a slight decrease from 2014 comparative periods of 33% and 32%, respectively. As the rig count has dropped substantially over the 2014 comparative periods, the timing of when customers ramp-up or slow down drilling activities has a significant effect on market share at any point in time as one rig can change the percentage of market share held.
- Revenue per operating day remained consistent at $8,357 and $7,609 for the three and six months ended June 30, 2015 from $8,430 and $7,606 in the comparative periods of 2014 driven by a 9% and 8% increase in depth per well as customers continue to drill deeper, more complex wells in order to maximize their return per well in the current commodity environment.
- The fluids and solids equipment revenue is driven by the size of the available equipment fleet, utilization, and rental rates in any given period. Fluids and solids equipment revenues for the three and six months ended June 30, 2015 have decreased by 26% and 23% over the 2014 comparative periods. The decrease is due to a decrease in the utilization of the equipment fleet resulting from a slowdown in industry activity, pricing pressure on rental rates, and an extended spring break-up that impacted revenues for the three and six months ended June 30, 2015.
- The operating margin for the three and six months ended June 30, 2015 was 8% and 18%, down from 24% and 25% in the 2014 comparative periods. The DS division achieved record results in the 2014 comparative periods resulting from strong crude oil prices combined with a shorter than normal spring break-up. DS division's operating margin for the three and six months ended June 30, 2015 was impacted by a significant reduction in drilling activity resulting in price discounts given to customers to reflect the depressed price of crude oil, losses realized on oil based drilling fluids and the higher cost of specialty chemicals purchased from the U.S. due to foreign exchange fluctuations. Further, the reduction in drilling activity resulted in lower revenues from higher margin complementary products which are used in various types of drilling activities.
- G&A expense for the three and six months ended June 30, 2015 decreased 3% and 1% from the comparative periods of 2014. The decreases resulted from streamlining internal processes to create efficiencies, and cost saving initiatives implemented in the first quarter of 2015.
OS DIVISION OPERATING HIGHLIGHTS
|
Three Months Ended June 30, |
SIx Months Ended June 30, | |||||||
|
($000's) |
2015 |
2014 |
% Change |
2015 |
2014 |
% Change | ||
|
Revenue |
||||||||
|
OnSite services (a) |
26,306 |
21,273 |
24 |
57,600 |
44,920 |
28 | ||
|
Operating Expenses |
||||||||
|
OnSite services |
21,333 |
16,439 |
30 |
43,158 |
33,568 |
29 | ||
|
Deduct: non-recurring items |
||||||||
|
Severance and other related costs |
- |
- |
- |
(116) |
- |
100 | ||
|
OnSite services less non-recurring items (b) |
21,333 |
16,439 |
30 |
43,042 |
33,568 |
28 | ||
|
Operating Margin (1) (a-b) |
4,973 |
4,834 |
3 |
14,558 |
11,352 |
28 | ||
|
Operating Margin (1) as a % of revenue (a) |
19% |
23% |
25% |
25% |
||||
|
(1)Refer to "Non GAAP measures and operational definitions" and "Additional GAAP measures" for further information | ||||||||
Highlights for the OS division included:
- Diversified service lines and integrated service offerings, combined with the four strategic acquisitions completed in 2014 delivered strong results in the OS division for the three and six months ended June 30, 2015. Revenues increased by 24% and 28% to $26.3 million and $57.6 million from $21.3 million and $44.9 million in the 2014 comparative periods.
- Projects revenue for the three and six months ended June 30, 2015 increased 57% and 67% due to an acquisition completed in April 2014 which added a new geographic area and increased customer base. In addition, there was an increase in large scale demolition and remediation projects that contributed to increased revenues over the 2014 comparative periods.
- IFS revenue for the three months ended June 30, 2015 decreased 32% from the 2014 comparative period as a direct result of a longer spring break-up reflective of typical second quarter activity, and the late ramp-up of drilling activity into June which delayed the start of projects. Revenue for the six months ended June 30, 2015 increased 8% over the 2014 comparative period due to one acquisition completed subsequent to the second quarter of 2014, fleet expansion, sustained equipment utilization during a period of slower industry activity, and increased offering of complementary services.
- Environmental services revenue for the three and six months ended June 30, 2015 has remained relatively consistent from the 2014 comparative periods. CleanSite bins were added to the rental fleet during 2014 and early 2015 sustaining revenues from the 2014 comparative periods. In addition, integrated service offerings with the Projects service line has resulted in the award of larger scale projects during the three months ended June 30, 2015 that will drive revenue for the remainder of 2015 including management of a producer owned landfill in the Alberta oilsands.
- Operating margins in the OS division are expected to be lower in the second quarter due to the timing of road bans and unpredictable weather that can cause project delays as equipment is not able to move out to site. Given the short spring break-up in 2014, equipment remained on site with little interruption to activity and completion of jobs. The extended spring break-up in 2015, influenced by muted drilling activity levels and commodity pricing, resulted in achieving an operating margin of 19% for the three months ended June 30, 2015, down from 23% in the 2014 comparative period.
- Operating margin for the six months ended June 30, 2015 was 25%, consistent with the 2014 comparative period. The operating margin for the OS division fluctuates depending on the volume and type of projects undertaken and the blend of business between remediation and reclamation projects, demolition projects, pipeline integrity projects, site clean-up, and other services in any given period. Larger scale demolition and remediation projects undertaken in the six months ended June 30, 2015 contributed a higher margin that has resulted in the division maintaining a consistent operating margin for the six month period ended June 30, 2015.
- G&A expenses for the three and six months ended June 30, 2015 increased 32% and 33% to $2.0 million and $4.3 million from $1.6 million and $3.2 million in the comparative periods of 2014. G&A expenses increased due to four acquisitions completed in 2014, an increase in activity and operations in the division and costs associated with moving to a new OS division office in the second quarter of 2014. G&A is expected to fluctuate based on the growth and activity of the division.
OUTLOOK
As expected, the second quarter of 2015 was impacted by an extended spring break-up, compounded by a weak commodity environment and a significant decrease in drilling and completion activity. In the third quarter of 2015, Secure expects a continued slow ramp-up of drilling and completion activity and anticipates that adjusted EBITDA will be consistent with the first quarter of 2015.
The Corporation is committed to creating capital efficiencies by identifying ways to bring projects online faster and more efficiently. As such, Secure will continue its prudent approach to capital spending by allocating capital to projects that generate the highest rates of return, including expansions of existing facilities. In addition to internal processes that have been successful at creating cost reductions and efficiencies, Secure is expecting a 10-20% decrease in capital cost estimates to construct facilities.
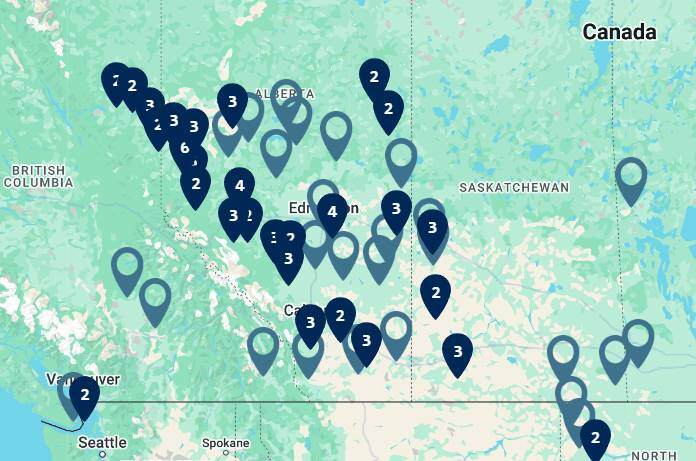
The long-term outlook on commodity prices and drilling and completion activity levels remains difficult to predict; however, Secure is well positioned for success in 2015 and beyond. In the PRD division, Secure now has 38 facilities that are strategically located in each of the high impact resource plays in Western Canada and North Dakota, including: Montney, Duvernay, Deep Basin, Cardium, Viking and the Bakken, which have all remained active during the relatively low oil and gas price environment. In the DS division, Secure continues to invest in research and development and successfully innovate new solutions to drive down the number of days it takes to drill a well, create efficiencies and lower costs. The production chemicals service line continues to find new ways to help customers. In the third quarter Secure will be conducting a chemical enhanced oil recovery pilot project in the Alberta oilsands. In the OS division, Secure has diversified its service lines through strategic acquisitions and achieves best in-class safety standards all of which assist the division in winning contracts with large customers. The OS division's first oilsands contract to manage solid waste was executed during the quarter.
Secure continues to maintain a strong balance sheet and is well positioned to respond to the market's needs now, and when industry activity resumes. Despite the continued relatively low commodity price environment and its impact on drilling and completions activity in the second quarter of 2015, Secure will maintain focus on organic growth to respond to customer demands, acquisition opportunities and continuous improvement initiatives to create efficiencies in internal processes and operations.
FINANCIAL STATEMENTS AND MD&A
The condensed consolidated financial statements and MD&A of Secure for the three and six months ended June 30, 2015 are available immediately on Secure's website at www.secure-energy.com. The condensed consolidated financial statements and MD&A will be available tomorrow on SEDAR at www.sedar.com.
FORWARD-LOOKING STATEMENTS
Certain statements contained in this document constitute "forward-looking statements" and/or "forward-looking information" within the meaning of applicable securities laws (collectively referred to as forward-looking statements). When used in this document, the words "may", "would", "could", "will", "intend", "plan", "anticipate", "believe", "estimate", "expect", and similar expressions, as they relate to Secure, or its management, are intended to identify forward-looking statements. Such statements reflect the current views of Secure with respect to future events and operating performance and speak only as of the date of this document. In particular, this document contains or implies forward-looking statements pertaining to: corporate strategy; goals; general market conditions; the oil and natural gas industry; activity levels in the oil and gas sector, including market fundamentals and the impact to each division on revenue and operating margins, drilling levels, commodity prices for oil, natural gas liquids ("NGLs") and natural gas; industry fundamentals for the third and fourth quarters of 2015; capital forecasts and spending by producers; demand for the Corporation's services; expansion strategy; the impact of the reduction in oil and gas activity on 2015 activity levels; revenue and operating margin for the PRD, DS and OS divisions; the amount of the revised 2015 capital program; the amounts of the PRD, DS and OS divisions' proposed 2015 capital budgets and the intended use thereof; debt service; capital expenditures; completion of facilities; the impact of new facilities on the Corporation's financial and operational performance; future capital needs; access to capital; acquisition strategy; anticipated commissioning of the water recycling at South Grande Prairie FST, and the recovery of hydrocarbons technology.
Forward-looking statements concerning expected operating and economic conditions are based upon prior year results as well as the assumption that increases in market activity and growth will be consistent with industry activity in Canada, and the U.S. and growth levels in similar phases of previous economic cycles. Forward-looking statements concerning the availability of funding for future operations are based upon the assumption that the sources of funding which the Corporation has relied upon in the past will continue to be available to the Corporation on terms favourable to the Corporation and that future economic and operating conditions will not limit the Corporation's access to debt and equity markets. Forward-looking statements concerning the relative future competitive position of the Corporation are based upon the assumption that economic and operating conditions, including commodity prices, crude oil and natural gas storage levels, interest rates, the regulatory framework regarding oil and natural gas royalties, environmental regulatory matters, the ability of the Corporation and its subsidiaries' to successfully market their services and drilling and production activity in North America will lead to sufficient demand for the Corporation's services and its subsidiaries' services including demand for oilfield services for drilling and completion of oil and natural gas wells, that the current business environment will remain substantially unchanged, and that present and anticipated programs and expansion plans of other organizations operating in the energy service industry will result in increased demand for the Corporation's services and its subsidiary's services. Forward-looking statements concerning the nature and timing of growth are based on past factors affecting the growth of the Corporation, past sources of growth and expectations relating to future economic and operating conditions. Forward-looking statements in respect of the costs anticipated to be associated with the acquisition and maintenance of equipment and property are based upon assumptions that future acquisition and maintenance costs will not significantly increase from past acquisition and maintenance costs.
Forward-looking statements involve significant risks and uncertainties, should not be read as guarantees of future performance or results, and will not necessarily be accurate indications of whether such results will be achieved. Readers are cautioned not to place undue reliance on these statements as a number of factors could cause actual results to differ materially from the results discussed in these forward-looking statements, including but not limited to those factors referred to and under the heading "Business Risks" and under the heading "Risk Factors" in the Corporation's AIF for the year ended December 31, 2014. Although forward-looking statements contained in this document are based upon what the Corporation believes are reasonable assumptions, the Corporation cannot assure investors that actual results will be consistent with these forward-looking statements. The forward-looking statements in this document are expressly qualified by this cautionary statement. Unless otherwise required by law, Secure does not intend, or assume any obligation, to update these forward-looking statements.
Non GAAP Measures and Operational Definitions
|
(1) |
The Corporation uses accounting principles that are generally accepted in Canada (the issuer's "GAAP"), which includes, International Financial Reporting Standards ("IFRS"). These financial measures are Non-GAAP financial measures and do not have any standardized meaning prescribed by IFRS. These non-GAAP measures used by the Corporation may not be comparable to a similar measures presented by other reporting issuers. See the management's discussion and analysis available at www.sedar.com for a reconciliation of the Non-GAAP financial measures and operational definitions. These non-GAAP financial measures and operational definitions are included because management uses the information to analyze operating performance, leverage and liquidity. Therefore, these non-GAAP financial measures and operational definitions should not be considered in isolation or as a substitute for measures of performance prepared in accordance with GAAP. |
ABOUT SECURE ENERGY SERVICES INC.
SECURE is a TSX publicly traded energy services company that provides safe and environmentally responsible fluids and solids solutions to the oil and gas industry.
The Corporation operates three divisions:
Processing, Recovery and Disposal Division ("PRD"): The PRD division owns and operates midstream infrastructure that provides processing, storing, shipping and marketing of crude oil, oilfield waste disposal and recycling. Specifically these services are clean oil terminalling and rail transloading, custom treating of crude oil, crude oil marketing, produced and waste water disposal, oilfield waste processing, landfill disposal, and oil purchase/resale service. Secure currently operates a network of facilities throughout western Canada and in North Dakota, providing these services at its full service terminals, landfills, stand-alone water disposal facilities, and rail transloading facilities.
Drilling Services Division ("DS"): The DS division provides equipment and chemicals for building, maintaining, processing and recycling of drilling and completion fluids. The drilling fluids service line comprises the majority of the revenue for the division which includes the design and implementation of drilling fluid systems for producers drilling for oil, bitumen and natural gas. The DS division focuses on providing products and systems that are designed for more complex wells, such as medium to deep wells, horizontal wells and horizontal wells drilled into the oil sands.
OnSite Division ("OS"): The operations of the OS division include environmental services which provide pre-drilling assessment planning, drilling waste management, remediation and reclamation assessment services, laboratory services, and "CleanSite" waste container services; integrated fluid solutions which include water management, recycling, pumping and storage solutions; and projects which include pipeline integrity (inspection, excavation, repair, replacement and rehabilitation); demolition and decommissioning and reclamation and remediation of former wellsites, facilities, commercial and industrial properties.
SOURCE Secure Energy Services Inc.
